Les triangles à travers un cours de maths en 5ème est très nécessaire pour la progression de l’élève.
Cette leçon fait intervenir les notions suivantes :
– définition du triangle et triangles particuliers;
– construction avec le matériel de géométrie;
– inégalité triangulaire;
– définition et propriété de la médiatrice d’un segment;
– cercle circonscrit à un triangle;
– somme des mesures des angles d’un triangle.
L’élève devra être capable d’utiliser la propriété de l’inégalité triangulaire afin d’affirmer si un triangle est constructible connaissant la valeur des longueurs de ses trois côtés. Il devra, également, savoir tracer un triangle à l’aide du matériel de géométrie (règle, compas, équerre et rapporteur). Développer ses compétences en calcul en utilisant la propriété de la somme des mesures des trois angles dans un triangle ainsi que de savoir construire le cercle circonscrit à un triangle et la propriété d’équidistance d’une médiatrice.
I. Propriétés dans un triangles
1.L’inégalité triangulaire
La hauteur d’un triangle est la droite passant par un sommet du triangle et perpendiculaire à son côté opposé.
Pour tout triangle ABC, nous avons  .
.
Un triangle est constructible lorsque la plus grande longueur est inférieure ou égale à la somme des deux plus petites longueurs.
Remarque :
On peut interpréter l’inégalité en remarquant que le chemin le plus court est toujours la ligne droite.
Un point A appartient au segment [BC] équivaut à BC=BA +AC.
Lorsqu’il y a égalité dans l’inégalité triangulaire, le triangle ABC est tout de même constructible et est un triangle plat.

2. Somme des mesures des angles de triangles

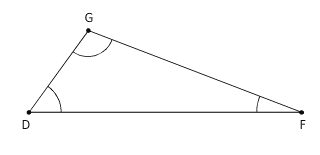
Exemple :
Dans le triangle ci-dessous, on sait que :
et .
La somme des mesures du triangle GDF est égale à 180°, donc :
II. Construction de triangles
1.Cas d’égalité de triangles
Deux triangles sont dits isométriques (ou semblables) si leurs côtés sont deux à deux de même longueur.
Exemple :
Les triangles ABC, DEF, GIH et JKL sont isométriques.
Ils sont superposables par glissement et/ou par retournement.
Si deux triangles ont un côté de même longueur compris entre deux angles de même mesure, deux à deux, alors ces deux triangles sont isométriques.
Exemple :
AB=DE.
Le côté [AB] est compris entre les angles et .
Le côté [DE] est compris entre les angles et .
De plus, et .
Donc les triangles ABC et EDF sont isométriques.
Si deux triangles ont un angle de même mesure compris entre deux cotés qui ont la même longueur alors ces deux triangles sont isométriques (ou semblables).
Exemple :
L’angle est compris entre les côtés [AC] et [AB].
L’angle est compris entre les côtés [EF] et [ED].
De plus, AC=EF et AB=ED.
Donc les triangles ABC et DEF sont isométriques.
Deux triangles semblables (ou isométriques) ont des angles de même mesure et des aires égales.
Remarque :
Attention, la réciproque n’est pas forcément vraie.
- Deux triangles peuvent avoir des angles de même mesure, deux à deux, sans pour autant être isométriques.
- Deux triangles peuvent avoir la même aire sans pour autant être isométriques.
III. Les médiatrices d’un triangle
Les médiatrices d’un triangle ABC sont concourantes en un point O qui est le centre du cercle circonscrit au triangle ABC.

Remarque :
Le point O est équidistant des trois sommets A, B et C du triangle ABC.
IV. Les hauteurs d’un triangle
La hauteur d’un triangle est une droite passant par un sommet et perpendiculaire à son coté opposé.
Les trois hauteurs d’un triangle sont concourantes en un point H appelé l’orthocentre du triangle.
Dans un triangle ABC, les trois hauteurs sont concourantes en un point H appelé l’orthocentre du triangle ABC.

Télécharger puis imprimer cette fiche en PDF.
Télécharger ou imprimer cette fiche «triangles : cours de maths en 5ème en PDF.» au format PDF afin de pouvoir travailler en totale autonomie.
D'autres cours et exercices à consulter
- Statistiques : cours de maths en 5ème en PDF.
- Calcul littéral : cours de maths en 5ème en PDF.
- Symétrie centrale : cours de maths en 5ème en PDF.
- Proportionnalité et pourcentages : cours de maths en 5ème en PDF.
- Fractions : cours de maths en 5ème en PDF.
- Priorités opérations : cours de maths en 5ème en PDF.
- Volumes : cours de maths en 5ème en PDF.
- Angles : cours de maths en 5ème en PDF.